Comparing Public Transit Modes in Greater Cairo
Formal transit networks are quite predictable and well-defined. Paratransit modes, on the other hand, can exhibit dynamic, interesting patterns that are unique to each local context. Identifying such patterns requires extensive data that covers the majority of trips and modes in the targeted region.
This analysis leverages TfC's GCR mobility data gathered over multiple data collection surveys, which were orchestrated using TfC's RouteLab Software Suite.
Data Overview
We start by reading in all the trips into a dataframe.
| gid | trip_short | agency_id | vehicle_name | len_km | fare | geom | |
|---|---|---|---|---|---|---|---|
| 0 | 3025 | Madinat Al Solb (Al Tibeen)-Ramses Station | CTA | Bus | 36.885011 | NaN | LINESTRING (1116749.522 1183560.929, 1116734.6... |
| 1 | 3026 | Bashtil-1st Settlement Station (New Cairo) | CTA | Bus | 41.396419 | NaN | LINESTRING (1103876.199 1216613.425, 1103865.9... |
| 2 | 3027 | Athar Al Naby-Khosous | CTA_M | Minibus | 32.482129 | NaN | LINESTRING (1108654.344 1206291.595, 1108667.7... |
| 3 | 3028 | Al Omraneyya Al Gadida-Ibrahim Bek | CTA | Bus | 24.617619 | NaN | LINESTRING (1104342.057 1206034.178, 1104337.0... |
| 4 | 3029 | Athar Al Naby-8th District (Nasr City) - Al tabba | CTA | Bus | 26.152755 | NaN | LINESTRING (1108653.298 1206291.112, 1108667.7... |
Number Of Trips Per Mode
Thevehicle_name field is the one of interest. Let's see what types of vehicles are used across the trips.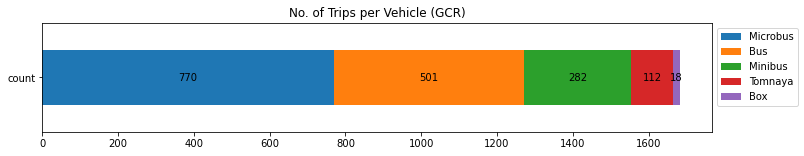
Below is a table showing how these modes different vehicles look like, their varying passenger capacities, licensing, and operators are all factors affecting their operational patterns.
| Tomnaya | 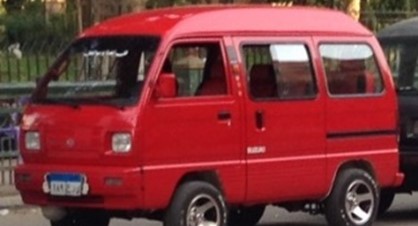 |
| Microbus | 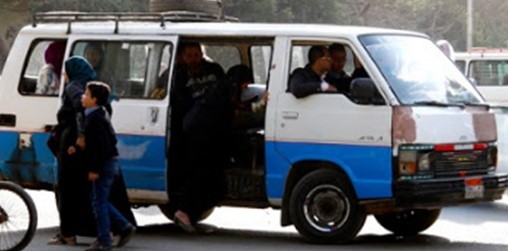 |
| Box | 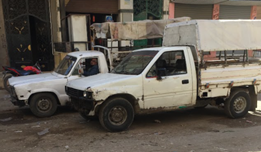 |
| Bus | 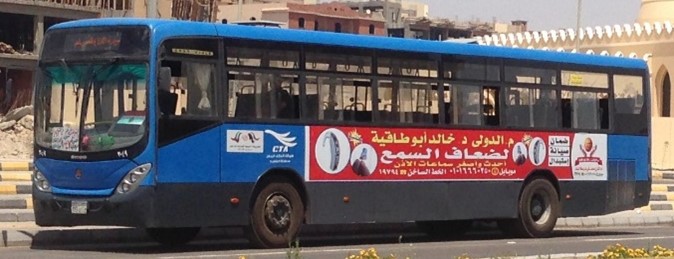 |
| Minibus | 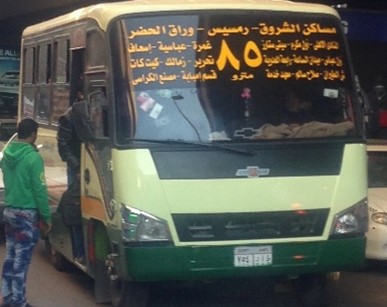 |
Fare Policy
Let's then explore the fare system for each mode. We plot the trip fare against trip length, disaggregated byvehicle_name.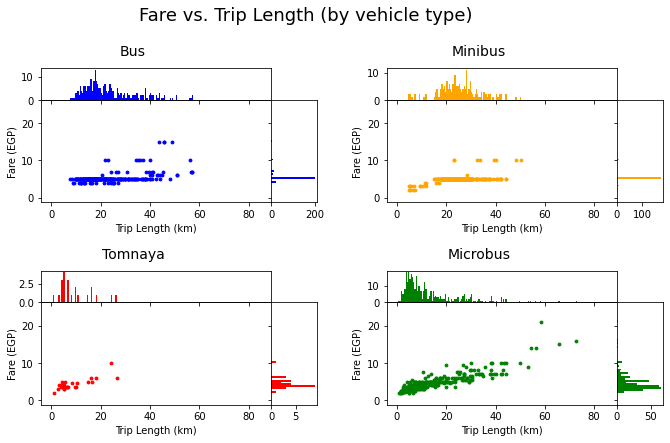
These plots tell us a lot about differences between the modes:
Bus & Minibus:
- Buses and Minibuses cover quite a large range, still smaller than that of the Microbus, from less than 5 to ~15 km.
Microbus:
Microbuses cover the largest range of trip lengths. i.e. the most versatile vehicle, used for local and express transit services.
Stratified fare without regard to length of trip. The fares histogram is dominated by the 5 EGP trips.
Microbus fares have a clear linear relationship with the trip length. That's due to the market dynamics setting the prices for the microbus services. Tomnaya trips exhibit the same nature.
Tomnaya:
- The Tomnaya's covers a low range of trip lengths, showing that it primarily serves last and first mile trips.
Speed
Averaged stats over a whole trip are not good enough for analysing the vehicle speed accurately. This section requires more granular data; at the level of segments stretching between pairs of stops.
Each two consecutive stops are considered an origin-destination (OD) pair. Average speed between stops is calculated for each mode and for each time interval across the day, using raw GPS data from multiple onboard surveys conducted by TfC.
We plot the histogram of speed per vehicle type.
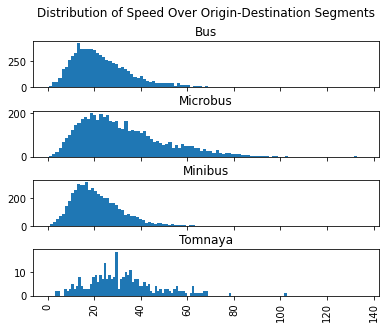
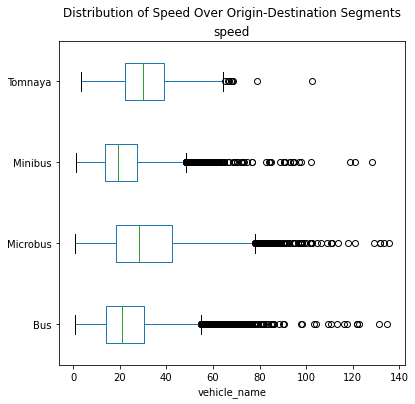
Similar to previous observations, the Bus and Minibus show the most similar patterns, with a mean at ~20 km/hr.
Microbus and Tomnaya have a similar mean and Inter-Quartile Range. However, the microbus's range is the uniquely the largest. Its distribution is also the most leaning towards higher speeds. Apart from having a smaller weight and passenger capacity, the higher means for th emicrobus and tomnaya show that they face less congestion than the other modes. The tomnaya primarily serves first and last mile rides in sprwaling new urban communities; where residential area roads are built wide and experience moderate demand. The microbus' high speeds, however,arise in long-distance express trips.
Boarding and Alighting (BA) Patterns
The (Fare vs. Trip Length) plots show that the main PT vehicles, bus, minibus and microbus, are all utilized to cover a large range of trip lengths, with the microbus trips having the largest range. However, visualizing boarding and alighting patterns along shared trip routes can help us better understand more nuanced and geographic differences between those modes.
In this part of the analysis, we actually need to dive deeper into the raw trip traces collected from the field. This raw field research data will show us the actual recorded BA patterns.
The most dissimilar types of PT vehicles on Egyptian streets are buses (~50 passengers) and microbuses (14 passengers). This is most apparent when comparing BA patterns. Moreover, manual inspection of trip GPS traces calls for a smaller, more manageable subset.
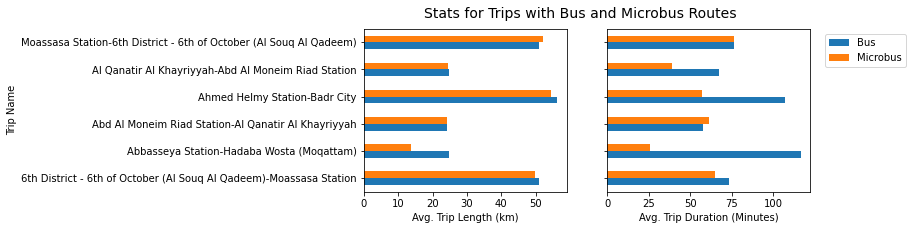
Ahmed Helmy Station-Badr City looks quite interesting; bus/microbus trip lengths are almost equal but trip duration duration by microbus is half the duration by bus.Abbasseya Station-Hadaba Wosta (Moqattam) and Al Qanatir Al Khayriyyah-Abd Al Moneim Riad Station trips are also have a significant difference between trip durations by bus and microbus. However, also the trip lengths differ in the former, which raises a question about the chosen route by the agency that runs each type of vehicle.Ahmed Helmy Station-Badr City and Abbasseya Station-Hadaba Wosta (Moqattam) are, therefore, suitable examples for further investigation of other aspects, such as Boarding/Alighting data.Let us start with the trip Ahmed Helmy Station-Badr City. We plot the recorded bus and microbus onboarding instances of the trip in an interactive map.Click on a stop to view board/alight numbers.
Given that this is the longest trip among the bus/microbus trips (50 km) and given the distribution of stops along the trip, it clearly is more of an express trip. There are only 3 stops in the microbus trip, compared to more than 15 stops in the bus trip.
Microbuses follow a fill-and-go system. Long-distance microbus trips do not board on the road only if a passenger alighted, which is uncommon. The microbus fare is usually higher than the bus fare for express trips, few passengers would pay the higher fare to alight mid-trip. Most passengers take the whole trip from origin to destination.
The recorded bus trips, which take pretty much the same route, are quite different. The bus moves from the origin terminal on time, regardless of number of boarded passengers. For the first half of the trip, few passengers alight from the bus, but much more board. Throughout the rest of the trip, boarding decreases significantly, alighting continues, but most passengers still alight the bus at the destination terminal.
The bus BA patterns show that it operates primarily as an express service, but still serves local trips along its route, contrary to the purely express trips offered by the microbus.
The BA patterns can explain the large difference in this trip's duration between bus and microbus, as shown in the bar plot. The bus stops at many points to board or alight, accumulating delay, as opposed to the microbus taking a one-shot trip to the destination.
Pretty insightful so far! Let's explore the second example tripAbbasseya Station-Hadaba Wosta (Moqattam).Click on a stop to view board/alight numbers.
This is a short trip, compared to the previous one. Still, it shows an even larger difference between bus and microbus in trip duration. The microbus takes a much shorter route than that of the bus.
The microbus BA pattern resemble that in the first trip, where passengers board at the beginning and only start to alight towards the end of the trip. This explains the route choice for the microbus; it takes the shortest route to the destination.
On the other hand, the bus takes a route that seems too long. The board/alight numbers justify that choice, though. This bus does not only operate as an express trip but serves local trips demand as well.
Conclusion
The bottomline from this BA patterns analysis is that express microbus trips are faster than their bus counterparts. while usually being higher in fare, and not having a reliable headway. On the other hand, express bus trips generally have fixed headway and a lower fare, but are delayed by frequent stops along the way.